I’ve been keeping track of every round of golf I play since 2000. I’m a little weird like that. Does anyone else do this? I don’t keep track of putts, birdies, sand saves, or anything extravagant like that. Date, course, and score are what I save into a little spread sheet which is has a sheet for each year, and then a stats sheet which gives some averages. I use Google Docs and Spreadsheets so I have easy access to the file wherever I have an Internet connection. Today Google added the ability to insert charts in spreadsheets, so I figured I’d have a little fun with it. Click each chart for a larger version.
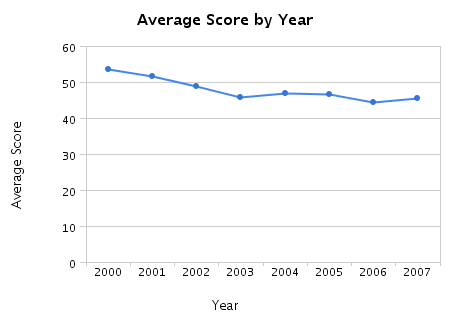
This first chart shows my average 9 hole score by year. I’ve come a long way since I started playing golf seriously back around 2000. I like the downward trend in scores!
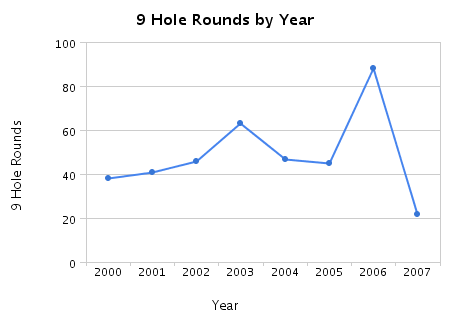
The second chart shows the number of 9 hole rounds I’ve played each year. Looks like the previous chart is definitely affected by this chart. The more I play, the better I get, and the more my average drops.
This chart shows the number of times I’ve shot in a certain range each year. Looks like I haven’t been in the 60s in quite some time. Now if I could eliminate the 50s that creep in once in awhile I’d be happy.

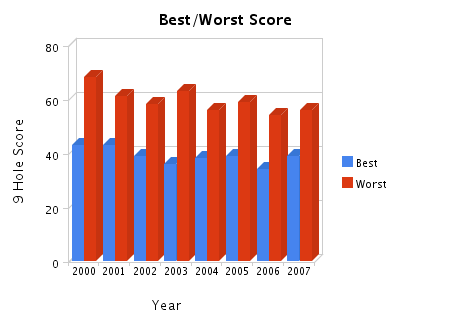
The final chart just shows the best and worst scores each year. Last year I managed a 1 under par 34 during league play. Hopefully I can improve on that by a stroke this year. I’ve already beat last years worst score by 2 strokes, which isn’t something I’d like to do.
If anyone is interested in the spreadsheet I use, I can try to explain it and make it available for download. The only goofy thing is when I enter a new year, it takes a little spreadsheet knowledge.

[…] had a little fun charting golf stats with the new charts functionality in Google Docs & Spreadsheets. Related Posts […]
LikeLike
I was hoping that you could email your cool speadsheet
LikeLike