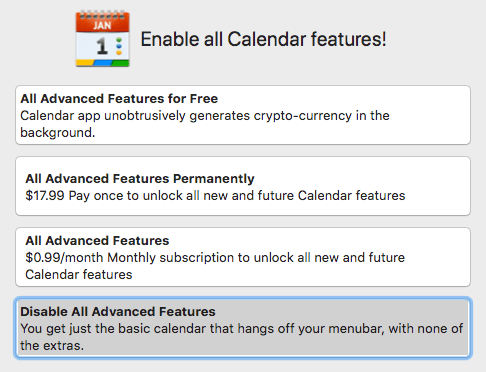
After updating apps today I got this pop-up. Check out the first option. Guess I’m uninstalling the Calendar 2 app!
After updating apps today I got this pop-up. Check out the first option. Guess I’m uninstalling the Calendar 2 app!
Fing is an iOS app that detects devices connected to a network. I ran it about 5 hours in to my DTW->AMS flight last week. Of the 47 devices found, only 12 were reporting as something other than an Apple product.

Electronics Engineering ToolKit is a useful iOS app if you’re messing around with electronics. I think I paid $6.99 to upgrade to Pro, which unlocks all of the formulas, reference material, and tools.

I recently posted Using a 555 Integrated Circuit. There are many ways to use these 555s. To get a sense of the power of this app, it has 10 tools in its 555 Timer IC group! Here’s a look at the Monostable operation mode. Each tool in the app has a great info panel like this one, describing what it does.

The tool itself gives 2 inputs where you set your resistor and capacitor values and it calculates the time for you.

It provides a circuit schematic where the R (resistor) & C (capacitor) values are updated instantly, based on you input values. This schematic doubles as a simulation, where it really gets cool. You can tap on the button to see how the circuit reacts. In this case, the LED turns green (ON) for 2.42 seconds and then turns off.

I wired up the circuit to try it for myself. Worked exactly as expected. I even triggered my live circuit and the simulation at the same time and the LEDs turned off simultaneously.

This is just one example of many useful things you can do in the Electronics Engineering ToolKit app, especially with the Pro upgrade. Not only can you favorite (as shown at the beginning of this post) the tools you find most useful, but the app also has a great search feature.
You can find similar tools for specific formulas and uses around the Internet, but I haven’t come across anything where it’s all in one place with an easy to use interface like this. Perhaps the best web site I’ve found is Basic Electronics Tutorials and Revision, which is a bit higher level in the way their descriptions.
The 4th part of this series was all about data and math. I like numbers, so it was exciting for me, but probably not for a lot of people.
I continued working on the user interface and tweaking how my app dealt with the data and formulas. Little changes in rounding decimal places could make a big difference. Eventually I got to the point where the UI had the basics to call it v1. It was just before midnight on the 20th, so I went from nothing to a functional interface over a weekend. It’s pretty much all I did for 2+ days.
I woke up on Monday and the damn calorie formula was still bugging me. I read through the Google Charts documentation again. I hadn’t even thought to try other types of trendlines, though I knew it wasn’t linear. The exponential example looked like the chart from the other Airdyne project I’d been referencing so I hadn’t thought twice about it. I couldn’t remember what a polynomial was so I looked it up. That project came up with a polynomial formula of degree 2.
I quickly changed my chart and immediately saw a better trendline with my plotted data. I’d been looking for the wrong type of trendline. I created a JSFiddle if you want to try your own.

The new calorie formula is nearly perfect! I’ve tweaked things a bit here and there and have seen less than a 2% difference from the actual display.
Go back to part 1 and check out the video of the Airdyne AD display if you don’t remember how it works and then compare to this new one…
I don’t show it until the end after I got off the Airdyne, but the toggling between imperial and metric distances can be done while working out too. Same with the switch from RPM to watts. I decided to keep the watts as an option even though I have no idea if they are right. It’s simply using the formula I found. What do you think? Which interface is better?
The code at this point was pretty ugly but function was the focus. The server listens for “beeps,” stores timestamps, and every second calculates new information for the different panels. Then it uses a Socket.IO Server to emit events with this data. Express handles all of the web server bits. What you see in this video is a browser in full screen mode with some simple HTML and CSS, a Socket.IO Client to listen for events from the server and emit a few action events back to the server, jQuery, and a little more javascript. Both the server and the client are on a single Raspberry Pi 3 Model B.
As a bonus, due to this structure, you don’t even need to have a display connected to a Raspberry Pi. If the Pi is connected to the same WiFi as a smart phone, tablet, or computer (something with touch is probably the best) you can use the device’s browser. In fact you don’t even need a Raspberry Pi. You can run the server from a Mac, which is how I’ve done all of the development.
This is a pretty simple UI but it does everything I was hoping I could do in a first version. The final post will show off the changes I’ve made in the last week (basically everything) and share my future plans.
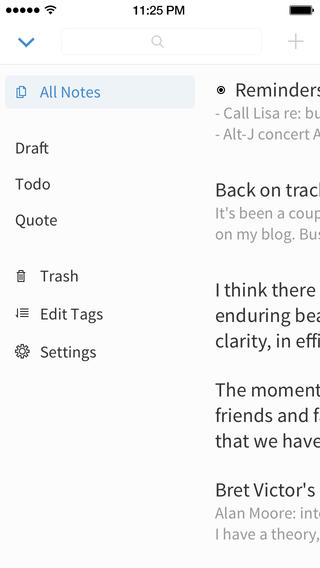 If you’re looking for a great note taking app, check out our free Simplenote app. There are all new versions for iOS, Android, Mac, and Kindle.
